Sample Digital Polygraph Report
This page does not explain the calculator's internal mechanics. It shows its practical output: what the user receives after completing an assessment and how to read the generated report.
Below is a real two-page report automatically generated by Digital Polygraph from user inputs. It records the selected product-delivery route, the distribution of labor intensity across stages, duration for the current team configuration, engineering delivery horizons, and the selected product elements and characteristics used for the assessment.
Page One: Route, Labor Intensity, Duration, and Team
Delivery Model
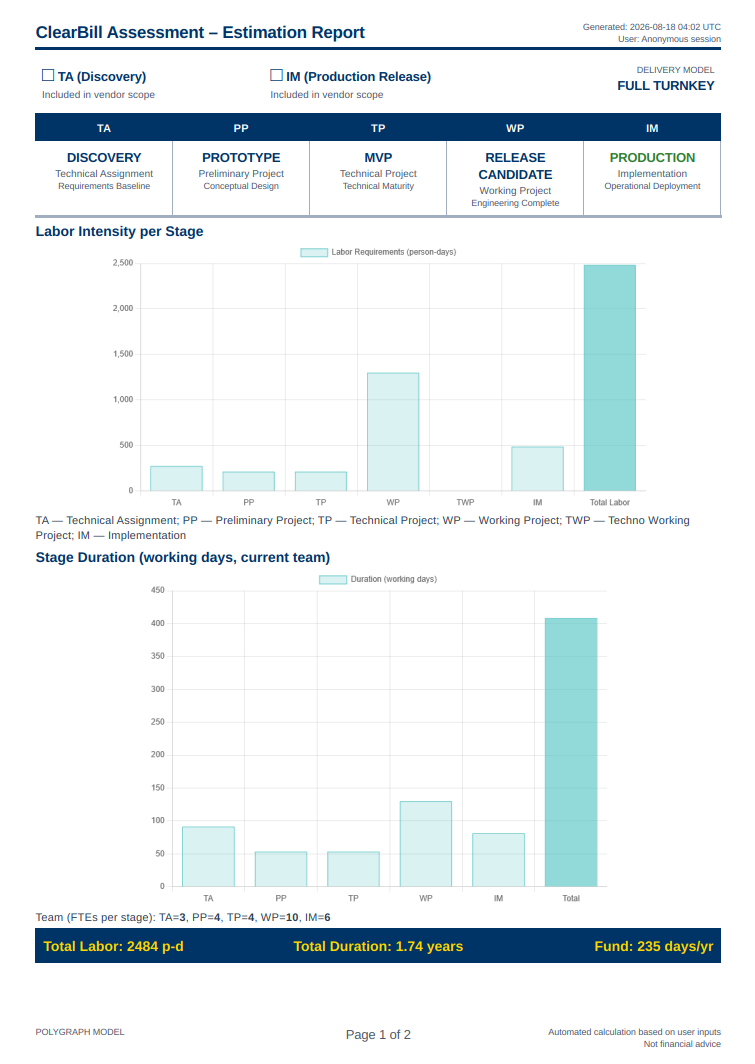
The top section of the report shows which route was selected for the product assessment. This example uses the full cycle:
TA → PP → TP → WP → IM
The same route is immediately expressed in product milestones: Discovery → Prototype → MVP → Release Candidate → Production. This lets the reader see not only the engineering stages, but also the level of product maturity reached at each one.
Labor Intensity per Stage
The first chart shows where the engineering work is concentrated. Total labor in this example is 2,484 person-days, but the report does not stop at one aggregate number: it shows how individual stages contribute to the total workload.
Duration with the Current Team
The second chart converts labor intensity into a delivery timeline using the team size assigned to each stage. In this example, the report calculates:
Team size by stage in this example: TA=3, PP=4, TP=4, WP=10, IM=6 FTEs. FTE means full-time equivalent: the workload capacity of one full-time team member.
Labor intensity answers the question “how much work?”. Duration and team size answer “how long, and with what resources?”.
Page Two: Engineering Horizons and Selected Product Elements and Characteristics
Calculated Engineering Delivery Horizons
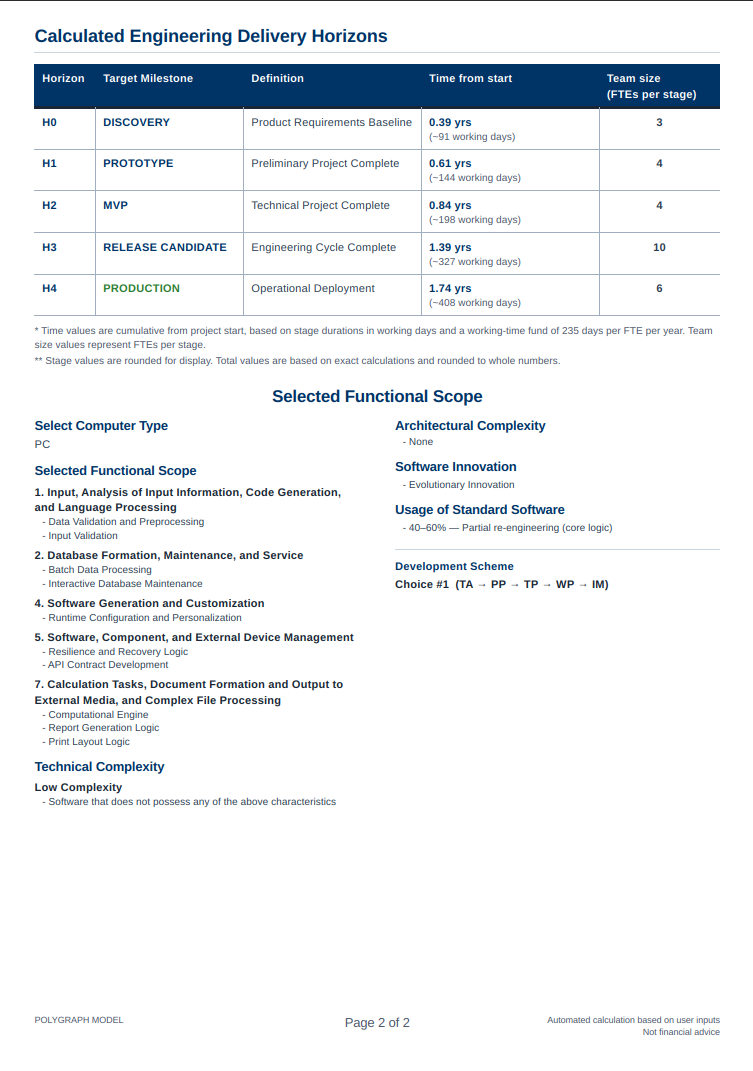
The main block on the second page shows when the product reaches each control milestone and the team size assigned to the corresponding stage. Time values in the table are cumulative from project start.
| Horizon | Target milestone | Time from start | Team |
|---|---|---|---|
| H0 | Discovery | 0.39 yrs (~91 working days) | 3 FTEs |
| H1 | Prototype | 0.61 yrs (~144 working days) | 4 FTEs |
| H2 | MVP | 0.84 yrs (~198 working days) | 4 FTEs |
| H3 | Release Candidate | 1.39 yrs (~327 working days) | 10 FTEs |
| H4 | Production | 1.74 yrs (~408 working days) | 6 FTEs |
This turns a single overall estimate into a sequence of verifiable intermediate finish points. Instead of one distant “release someday,” the report provides a route showing when the product is expected to reach Prototype, MVP, Release Candidate, and Production.
What Was Evaluated
The lower part of the second page preserves the context of the calculation. This matters because an effort number should not exist separately from the description of the product for which it was obtained.
In this example, the report records, among other things:
- the selected computer type;
- the selected functional scope;
- technical complexity;
- architectural complexity;
- software innovation;
- the degree of standard-software usage;
- the selected development scheme.
In this way, the report keeps the assessment result together with the conditions under which that result was obtained. It does not disclose the internal calculation mechanics, but it makes clear which product and which delivery route were assessed.
Fixed Milestones, Agile Execution
The engineering stages shown in the report do not mean that the team must execute the work as a rigid sequential process. The user selects the route: how many stages it contains, which stages are included, and which product goal or goals they are intended to reach.
Once the route is selected, each engineering stage defines a frame and a measurable intermediate finish point. Within that frame, the team can organize its work with Scrum, Agile, Kanban, or another methodology: using sprints, a backlog, planning poker, and its own rhythm of planning and reviewing results.
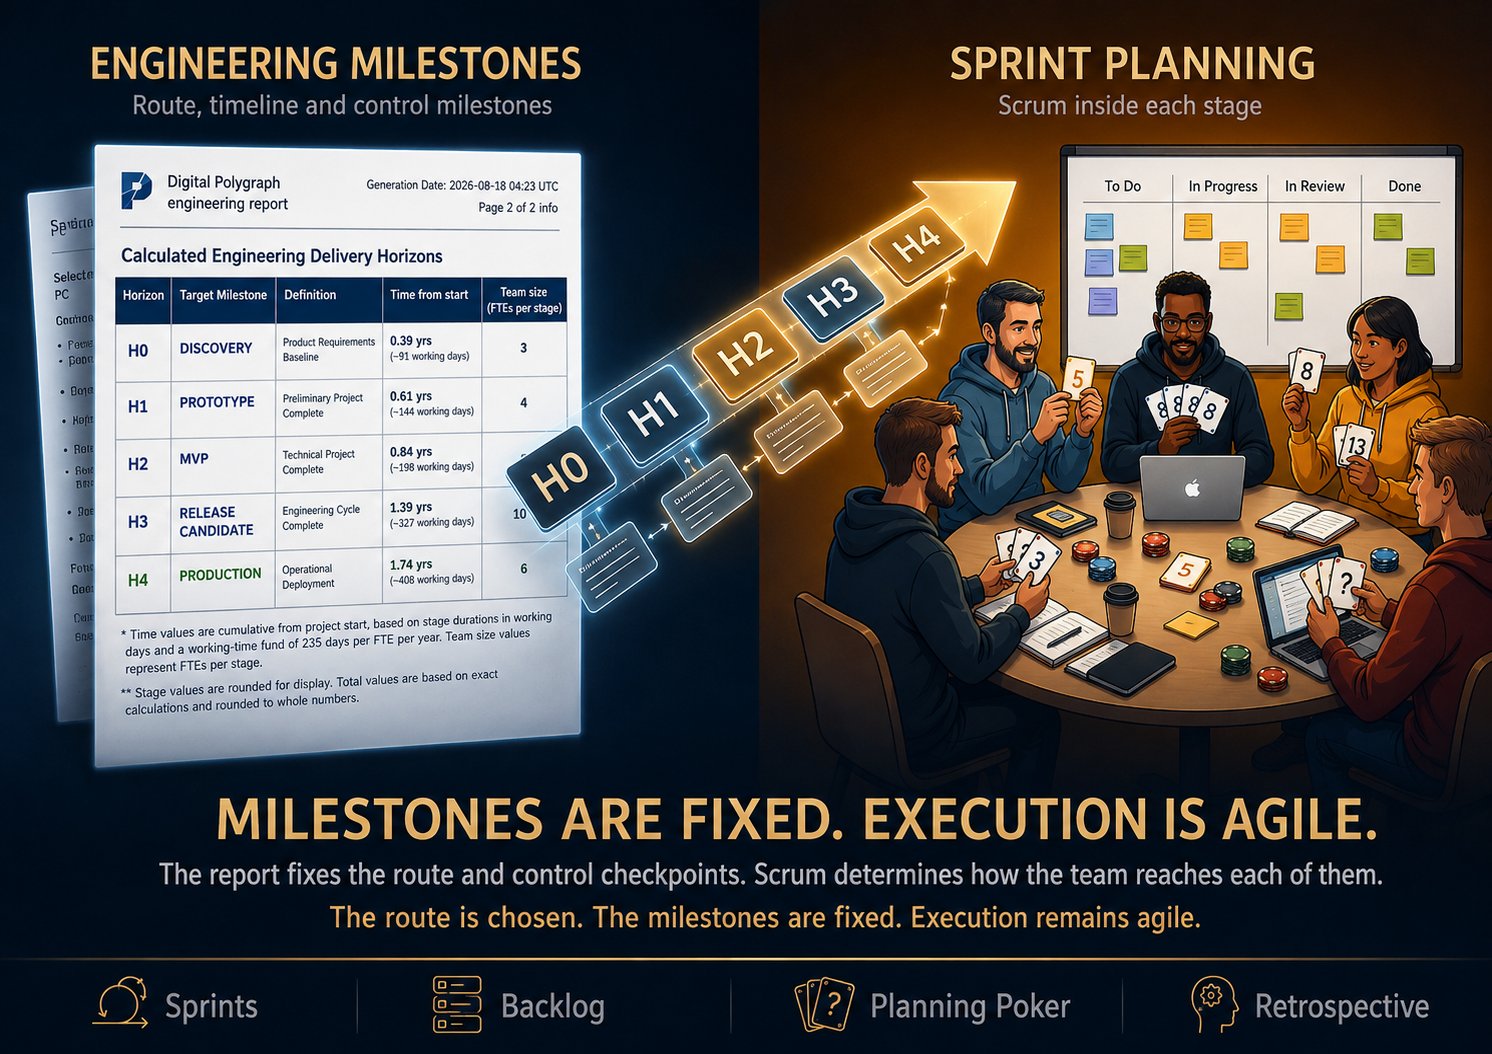
The route is chosen. The milestones are fixed. Execution remains agile.
Engineering estimation and Scrum therefore do not contradict each other. They operate at different levels: the report establishes where the product must arrive and by what point in the route, while the team's methodology determines how work is organized within that segment.
What One Report Can Tell You
A Digital Polygraph report can answer concrete questions about a future software product:
- What exactly was assessed? — The product's functional scope and characteristics are recorded in the report.
- Which route was selected? — The report shows the selected engineering stages and product milestones.
- How much work is required? — Labor intensity is shown both overall and by stage.
- How long will it take? — Duration is calculated for the current team configuration.
- What team is required? — FTEs are shown for each stage.
- When will the product reach Prototype, MVP, Release Candidate, and Production? — The H0-H4 horizons provide those checkpoints.
Get a Report for Your Product
Above you can see both pages of a real sample report. To get the same structured result for your own software product, run a Digital Polygraph assessment.
For the principles behind the product's structural description, see “Internal Principles of the Effort Calculator”. For turning labor intensity into delivery dates and a team plan, see “Theory: An Engineering Method to Control Software Delivery Dates”.